Marketing metrics recipes
This article helps you:
Use Amplitude charts to analyze common marketing metrics
Amplitude Analytics provides a multitude of insights into the success of your product's marketing efforts. This article highlights the ingredients needed to recreate common marketing metrics using Event Segmentation or User Sessions charts.
Before you begin
If you haven’t already read up on the basics of building charts in Amplitude, you should do so before proceeding.
Some setup instructions in this article require the use of custom formulas. See this article to read more about custom formula metrics, syntax, and definitions.
Metric recipes
The examples in this section provide a starting point for setting up each metric. As with other analyses, use filters, group-bys, or segmentation to refine results.
| Session totals | Visitors | Sessions per user |
| Average session duration | Page views | Page views per session |
| Bounce rate | Entry rate | Exit rate |
Note
Session totals
The session totals metric provides a sum of sessions.
Use the following setup for each module in your User Sessions chart to create the session totals metric:
-
Sessions:
Countsessions for all sessionsIf desired, filter results by a specific domain or URL:
- Click Filter by and choose
Contains Event. Search for thePage Viewedevent. Set the count to greater than or equal to one. - Click the Filter to add a where clause for your desired
Page URL.
- Click Filter by and choose
-
Measured as:
Total Sessions -
Segmented by: All users
Visitors
The visitors metric gives a count of unique users who trigger a specific event.
Use the following setup for each module in your Event Segmentation chart to create the visitors metric:
-
Events:
Page ViewIf desired, filter results by a specific domain or URL:
- Click Filter by and choose
Page URL. Select the checkbox next to your desired domain and click Apply.
- Click Filter by and choose
-
Measured as:
Uniques -
Segmented by: All users
Sessions per user
The sessions per user metric gives an average count of sessions by unique user.
Use the following setup for each module in your User Session chart to create the sessions per user metric:
- Sessions:
Countsessions for all sessions
If desired, filter results by a specific domain or URL:
-
Click Filter by and choose
Contains Event. Search for thePage Viewedevent. Set the count to greater than or equal to one.- Click Filter to add a where clause for your desired
Page URL.
- Click Filter to add a where clause for your desired
-
Measured as:
Avg Per User -
Segmented by: All users
Average session duration
The average session duration metric gives an average length of sessions.
Use the following setup for each module in your User Sessions chart to create the average session duration metric:
- Sessions:
Countsessions for all sessions
If desired, filter results by a specific domain or URL:
-
Click Filter by and choose
Contains Event. Search for your desiredPage Viewevent. Set the count to greater than or equal to one.- Click Filter to add a where clause for your desired
Page URL.
- Click Filter to add a where clause for your desired
-
Measured as:
Avg length(counting in days, hours, minutes) -
Segmented by: All users
Page views
The page views metric gives a sum of page views events.
Use the following setup for each module in your Event Segmentation chart to create the page views metric:
- Events:
Page View
If desired, filter results by a specific domain or URL:
-
Click Filter by and choose
Page URL. Select the checkbox next to your desired domain and click Apply. -
Measured as:
Event Totals -
Segmented by: All users
Page views per session
The page views per session gives an average count of Page View events per session.
Use the following setup for each module in your User Session chart to create the page views per session metric:
- Sessions:
Countevents performed within sessions for all sessionsBy Event Countof thePage Viewevent
If desired, filter results by a specific domain or URL:
-
Click Filter by and choose
Contains Event. Search for thePage Viewedevent. Set the count to greater than or equal to one.- Click Filter to add a where clause for your desired
Page URL.
- Click Filter to add a where clause for your desired
-
Measured as:
Avg events per session -
Segmented by: All users
Bounce rate
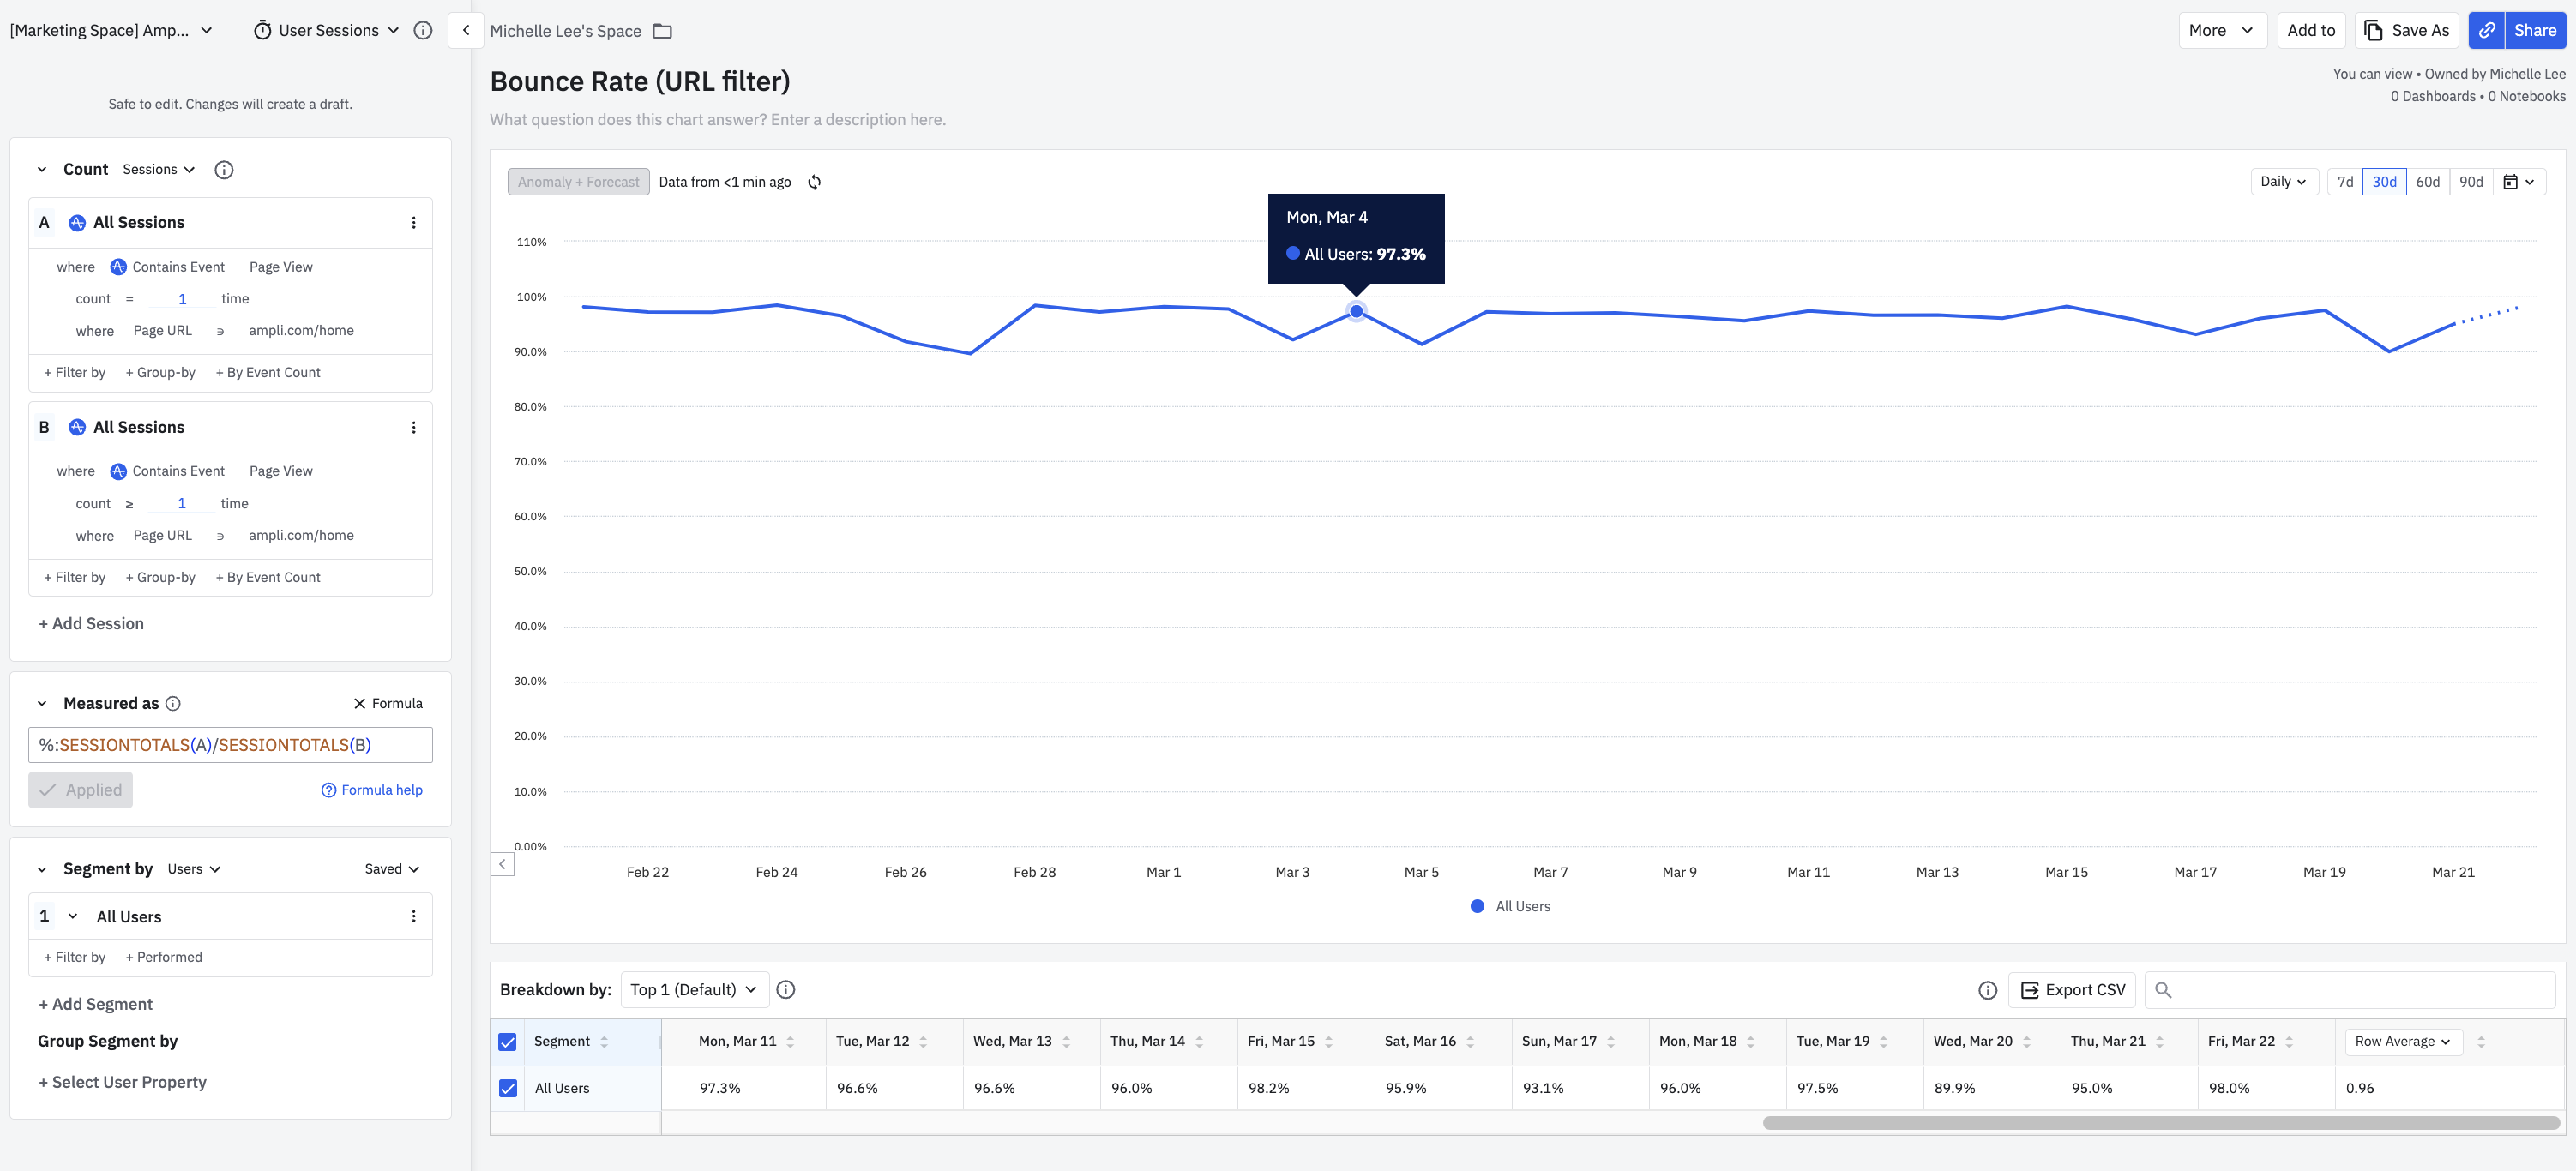
The bounce rate metric compares the count of sessions with a single Page View event to the total number of sessions as a percentage.
Use the following setup for each module in your User Sessions chart to create the bounce rate metric:
-
Sessions:
Countsessions- A: All sessions
- where
Contains Event=Page Viewedwith a count of one
- where
- B: All sessions
- A: All sessions
If desired, filter results by a specific domain or URL of each session:
-
Click Filter by and choose
Contains Eventfor session B. Search for thePage Viewedevent. Set the count to greater than or equal to one for session B.- Click Filter to add a where clause for your desired
Page URLfor sessions A and B.
- Click Filter to add a where clause for your desired
-
Measured as: Formula
%:SESSIONTOTALS(A)/SESSIONTOTALS(B) -
Segmented by: All users
This User Sessions chart is set up to calculate the 30-day bounce rate for the Page URL ampli.com/home. The bounce rate for March 4th was 97.3 percent.
Entry rate
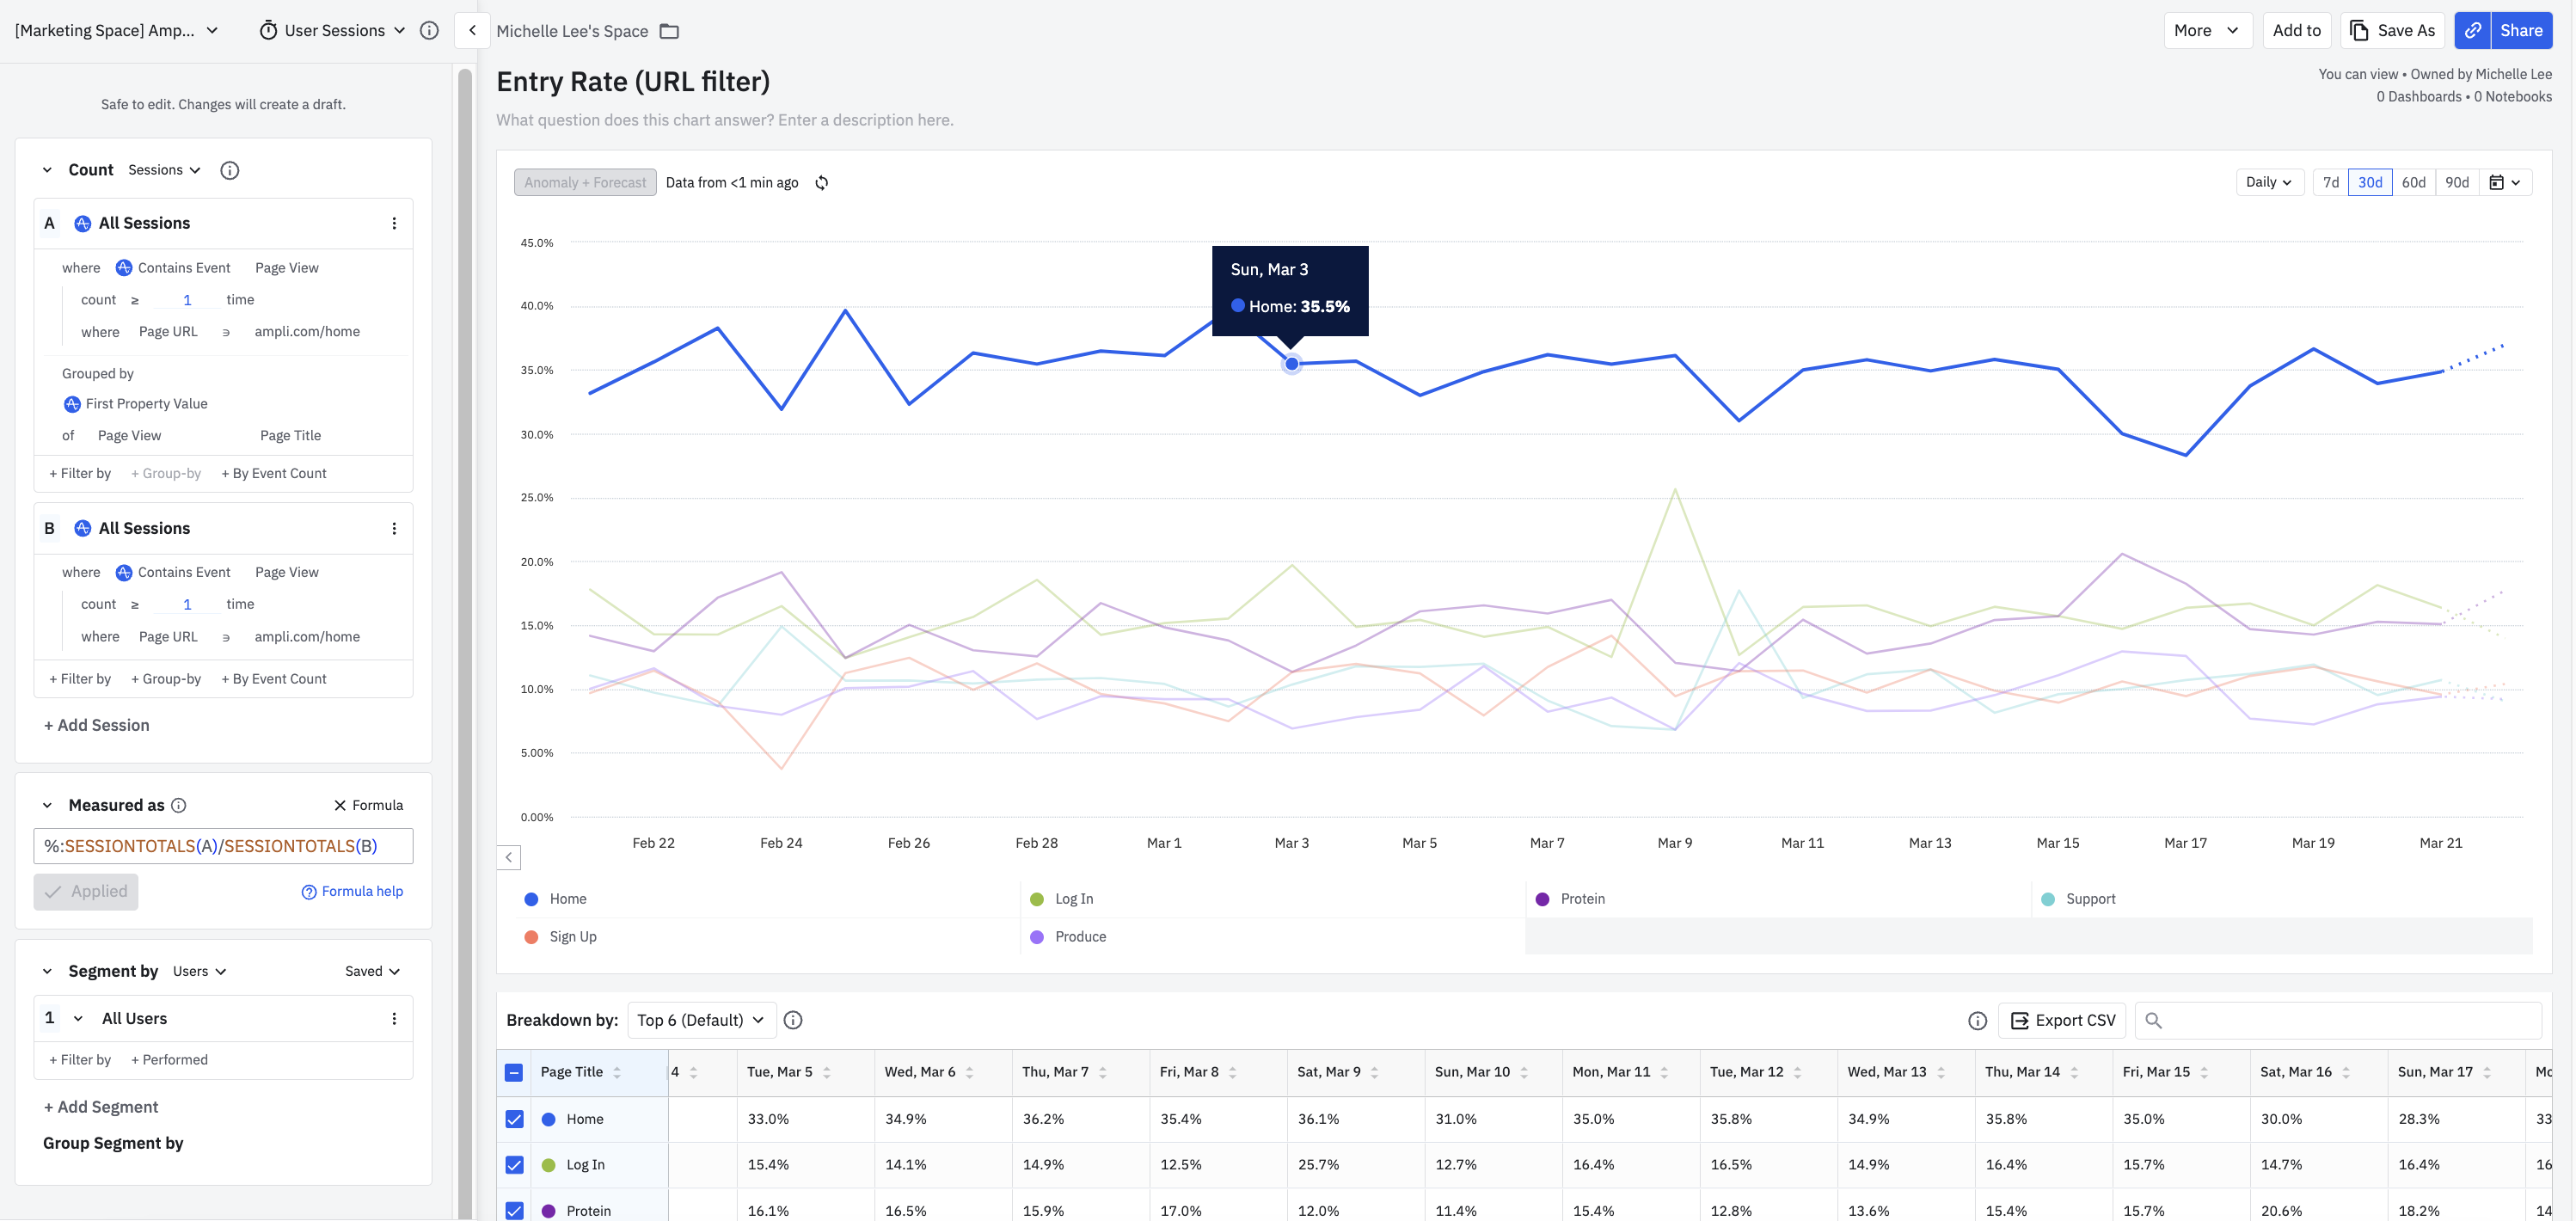
The entry rate metric gives the comparison of sessions with a Page View event grouped by the first property value of the specified event property to the total number of sessions as a percentage.
Use the following setup for each module in your User Sessions chart to create the entry rate metric:
-
Sessions:
Countsessions- A: All sessions
- Grouped by the
First Property Valueof thePage Viewevent propertyPage Title
- Grouped by the
- B: All sessions
- A: All sessions
If desired, filter results by a specific domain or URL of sessions A and B:
-
Click Filter by and choose
Contains Event. Search for thePage Viewedevent. Set the count to greater than or equal to one.- Click Filter to add a where clause for your desired
Page URL.
- Click Filter to add a where clause for your desired
-
Measured as: Formula
%:SESSIONTOTALS(A)/SESSIONTOTALS(B) -
Segmented by: All users
This User Sessions chart is set up to calculate the 30-day entry rate for the Page URL ampli.com/home. The chart’s group-by property value Page Title is seen as different colored lines in the chart. The entry rate for March 3rd was 35.5 percent for the Home property value.
Exit rate
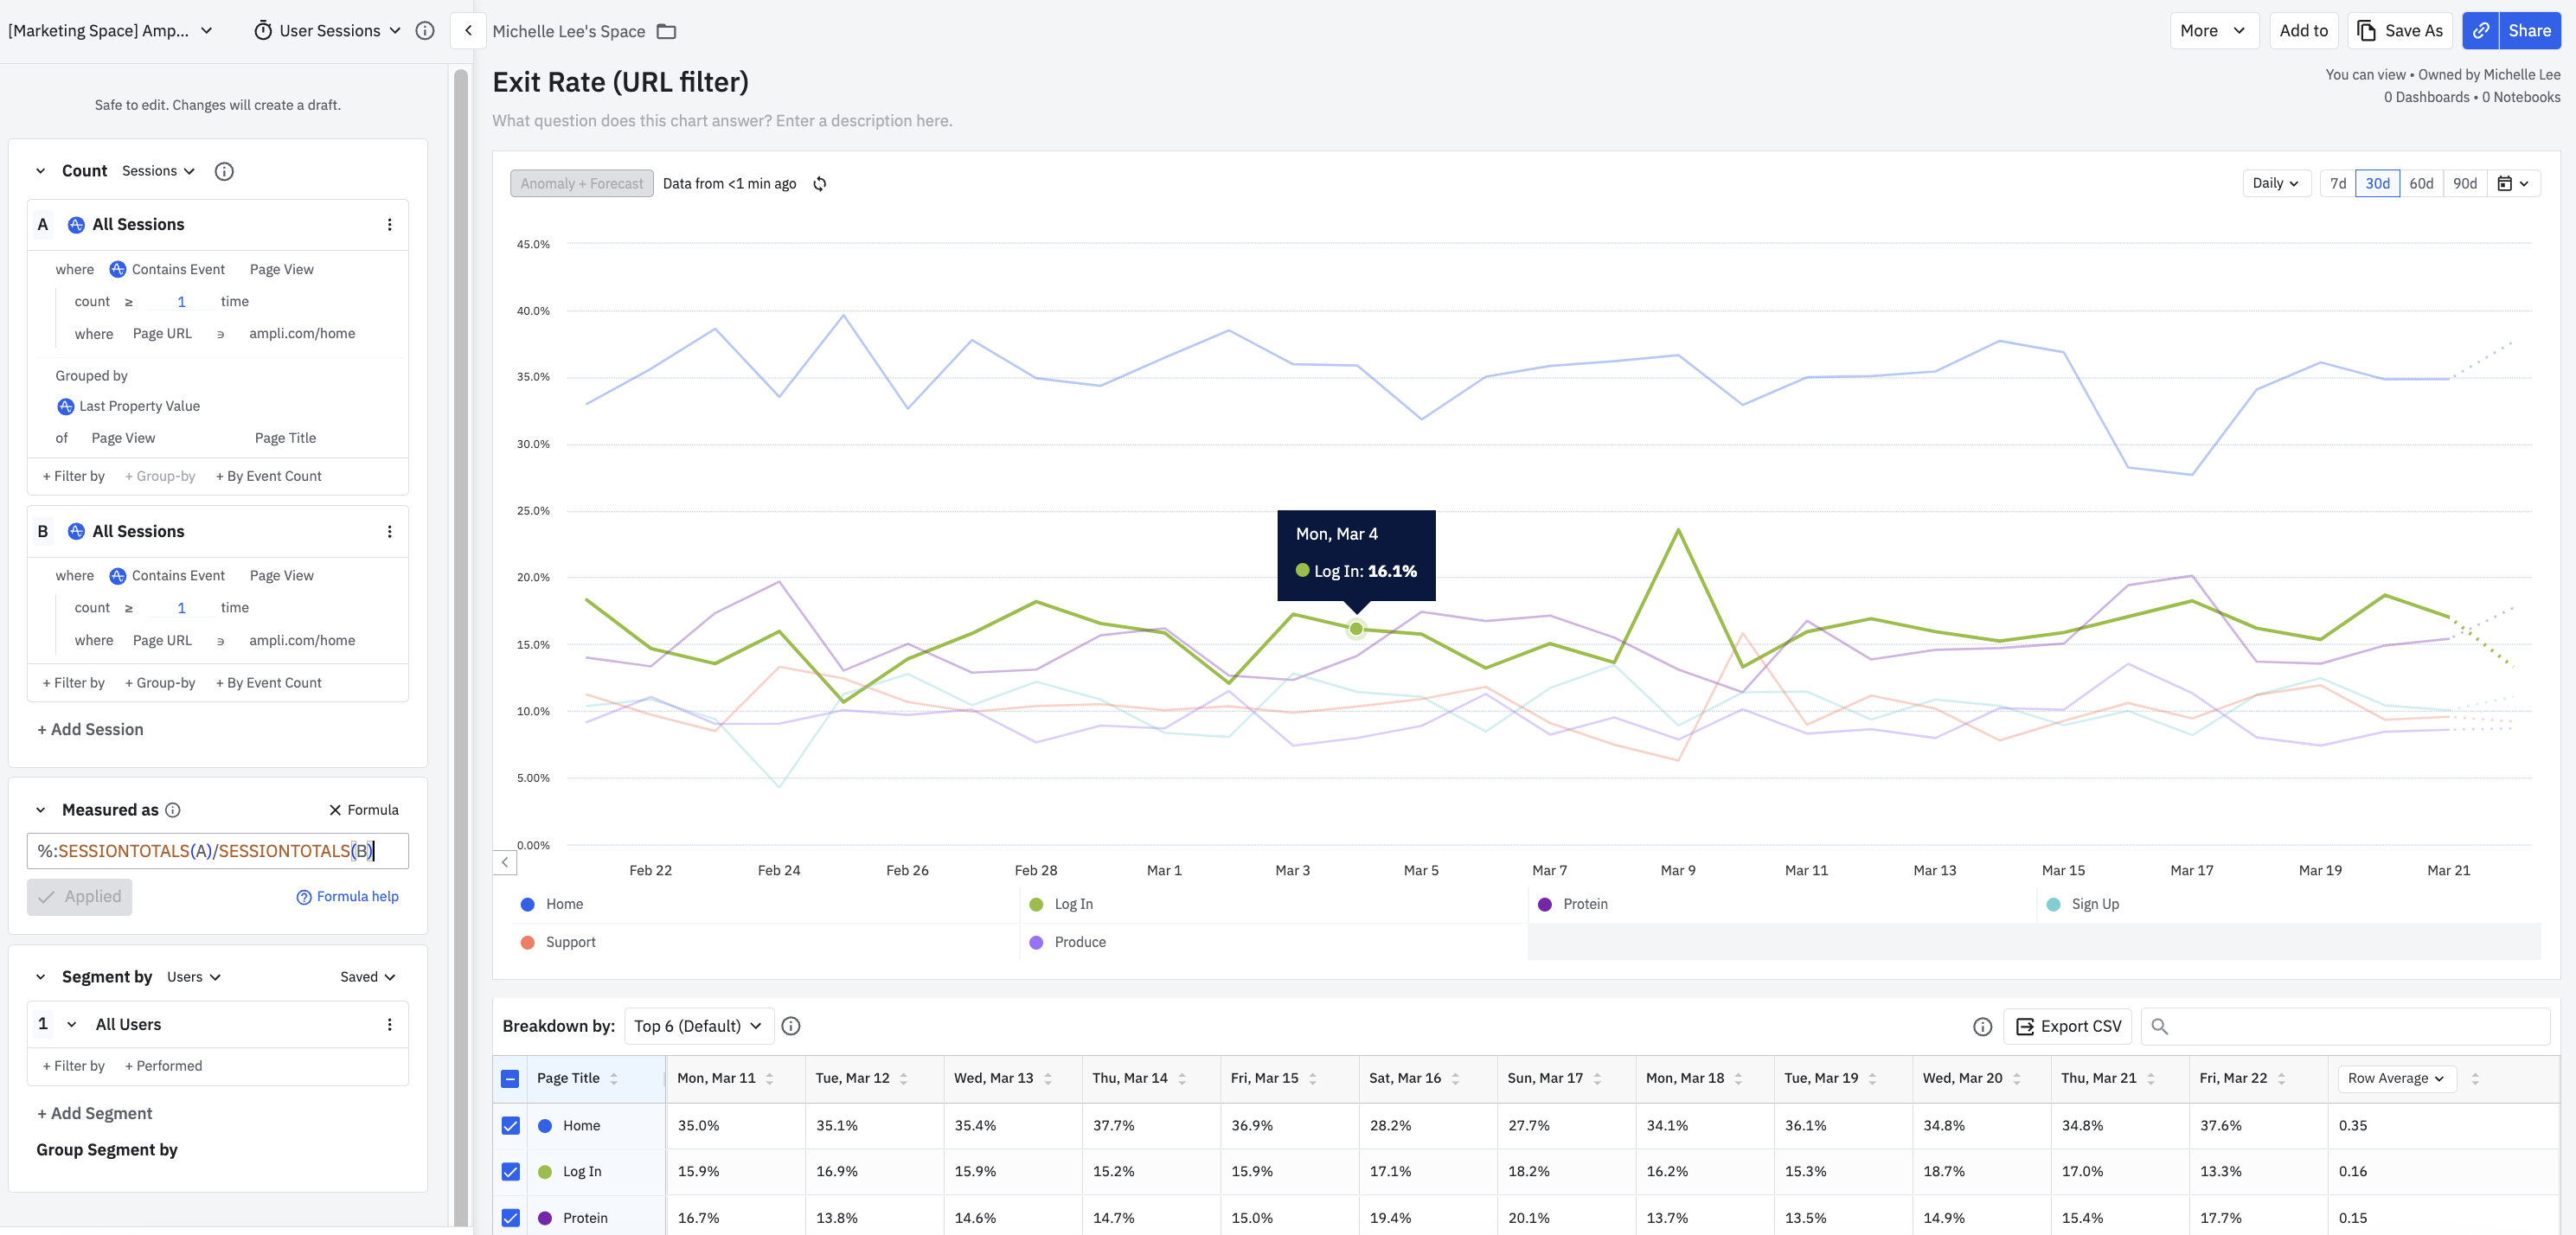
The exit rate metric gives the comparison of sessions with a Page View event grouped by the last property value of the specified event property to the total number of sessions as a percentage.
Use the following setup for each module in your User Sessions chart to create the exit rate metric:
-
Sessions:
Countsessions- A: All sessions
- Grouped by the
Last Property Valueof thePage Viewevent propertyPage Title
- Grouped by the
- B: All sessions
- A: All sessions
If desired, filter results by a specific domain or URL of sessions A and B:
-
Click Filter by and choose
Contains Event. Search for thePage Viewedevent. Set the count to greater than or equal to one.- Click Filter to add a where clause for your desired
Page URL.
- Click Filter to add a where clause for your desired
-
Measured as: Formula
%:SESSIONTOTALS(A)/SESSIONTOTALS(B) -
Segmented by: All users
This User Sessions chart is set up to calculate the 30-day exit rate for the Page URL ampli.com/home. The chart’s group-by property value Page Title is seen as different colored lines in the chart. The exit rate for March 4th was 16.1 percent for the Log In property value.
Performance marketing metrics
Amplitude supports the use of several common performance marketing metrics. Create these metrics by following the recipes in this section.
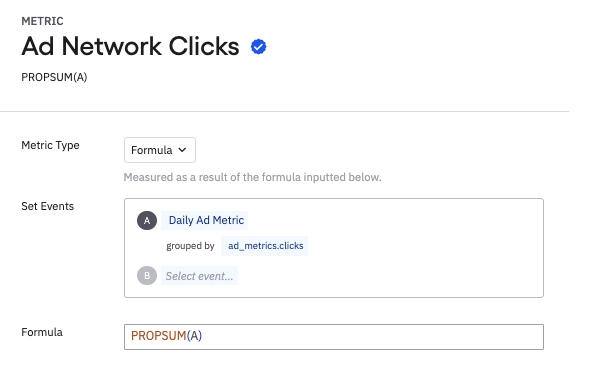
Ad network clicks
- Metric type:
Formula - Event:
Daily ad metric - Grouped by:
ad_metrics.clicks - Formula:
PROPSUM(A)
Ad network impressions
- Metric type:
Formula - Event:
Daily ad metric - Grouped by:
ad_metrics.impressions - Formula:
PROPSUM(A)
Ad network costs
- Metric type:
Formula - Event:
Daily ad metric - Grouped by:
ad_metrics.costs - Formula:
PROPSUM(A)
Return on ad spending
- Metric type:
Formula - Event A:
Complete purchase- Grouped by:
Revenue
- Grouped by:
- Event B:
Daily ad metric- Grouped by:
ad_metrics.cost
- Grouped by:
- Formula: %:
PROPSUM(A) / PROPSUM(B)
Customer acquisition cost
- Metric type:
Formula - Event A:
Daily ad metric- Grouped by:
ad_metrics.cost
- Grouped by:
- Event B:
User Sign Up - Formula: $:
PROPSUM(A) / TOTALS(B)
Clickthrough rate
- Metric type:
Formula - Event A:
Daily ad metric- Grouped by:
ad_metrics.impressions
- Grouped by:
- Event B:
Daily ad metric- Grouped by:
ad_metrics.clicks
- Grouped by:
- Formula: %:
PROPSUM(A) / PROPSUM(B)
September 12th, 2024
Need help? Contact Support
Visit Amplitude.com
Have a look at the Amplitude Blog
Learn more at Amplitude Academy
© 2025 Amplitude, Inc. All rights reserved. Amplitude is a registered trademark of Amplitude, Inc.