The Experiment Analysis view
This article helps you:
Understand what the Analysis view tells you about your experiment, and how to access it
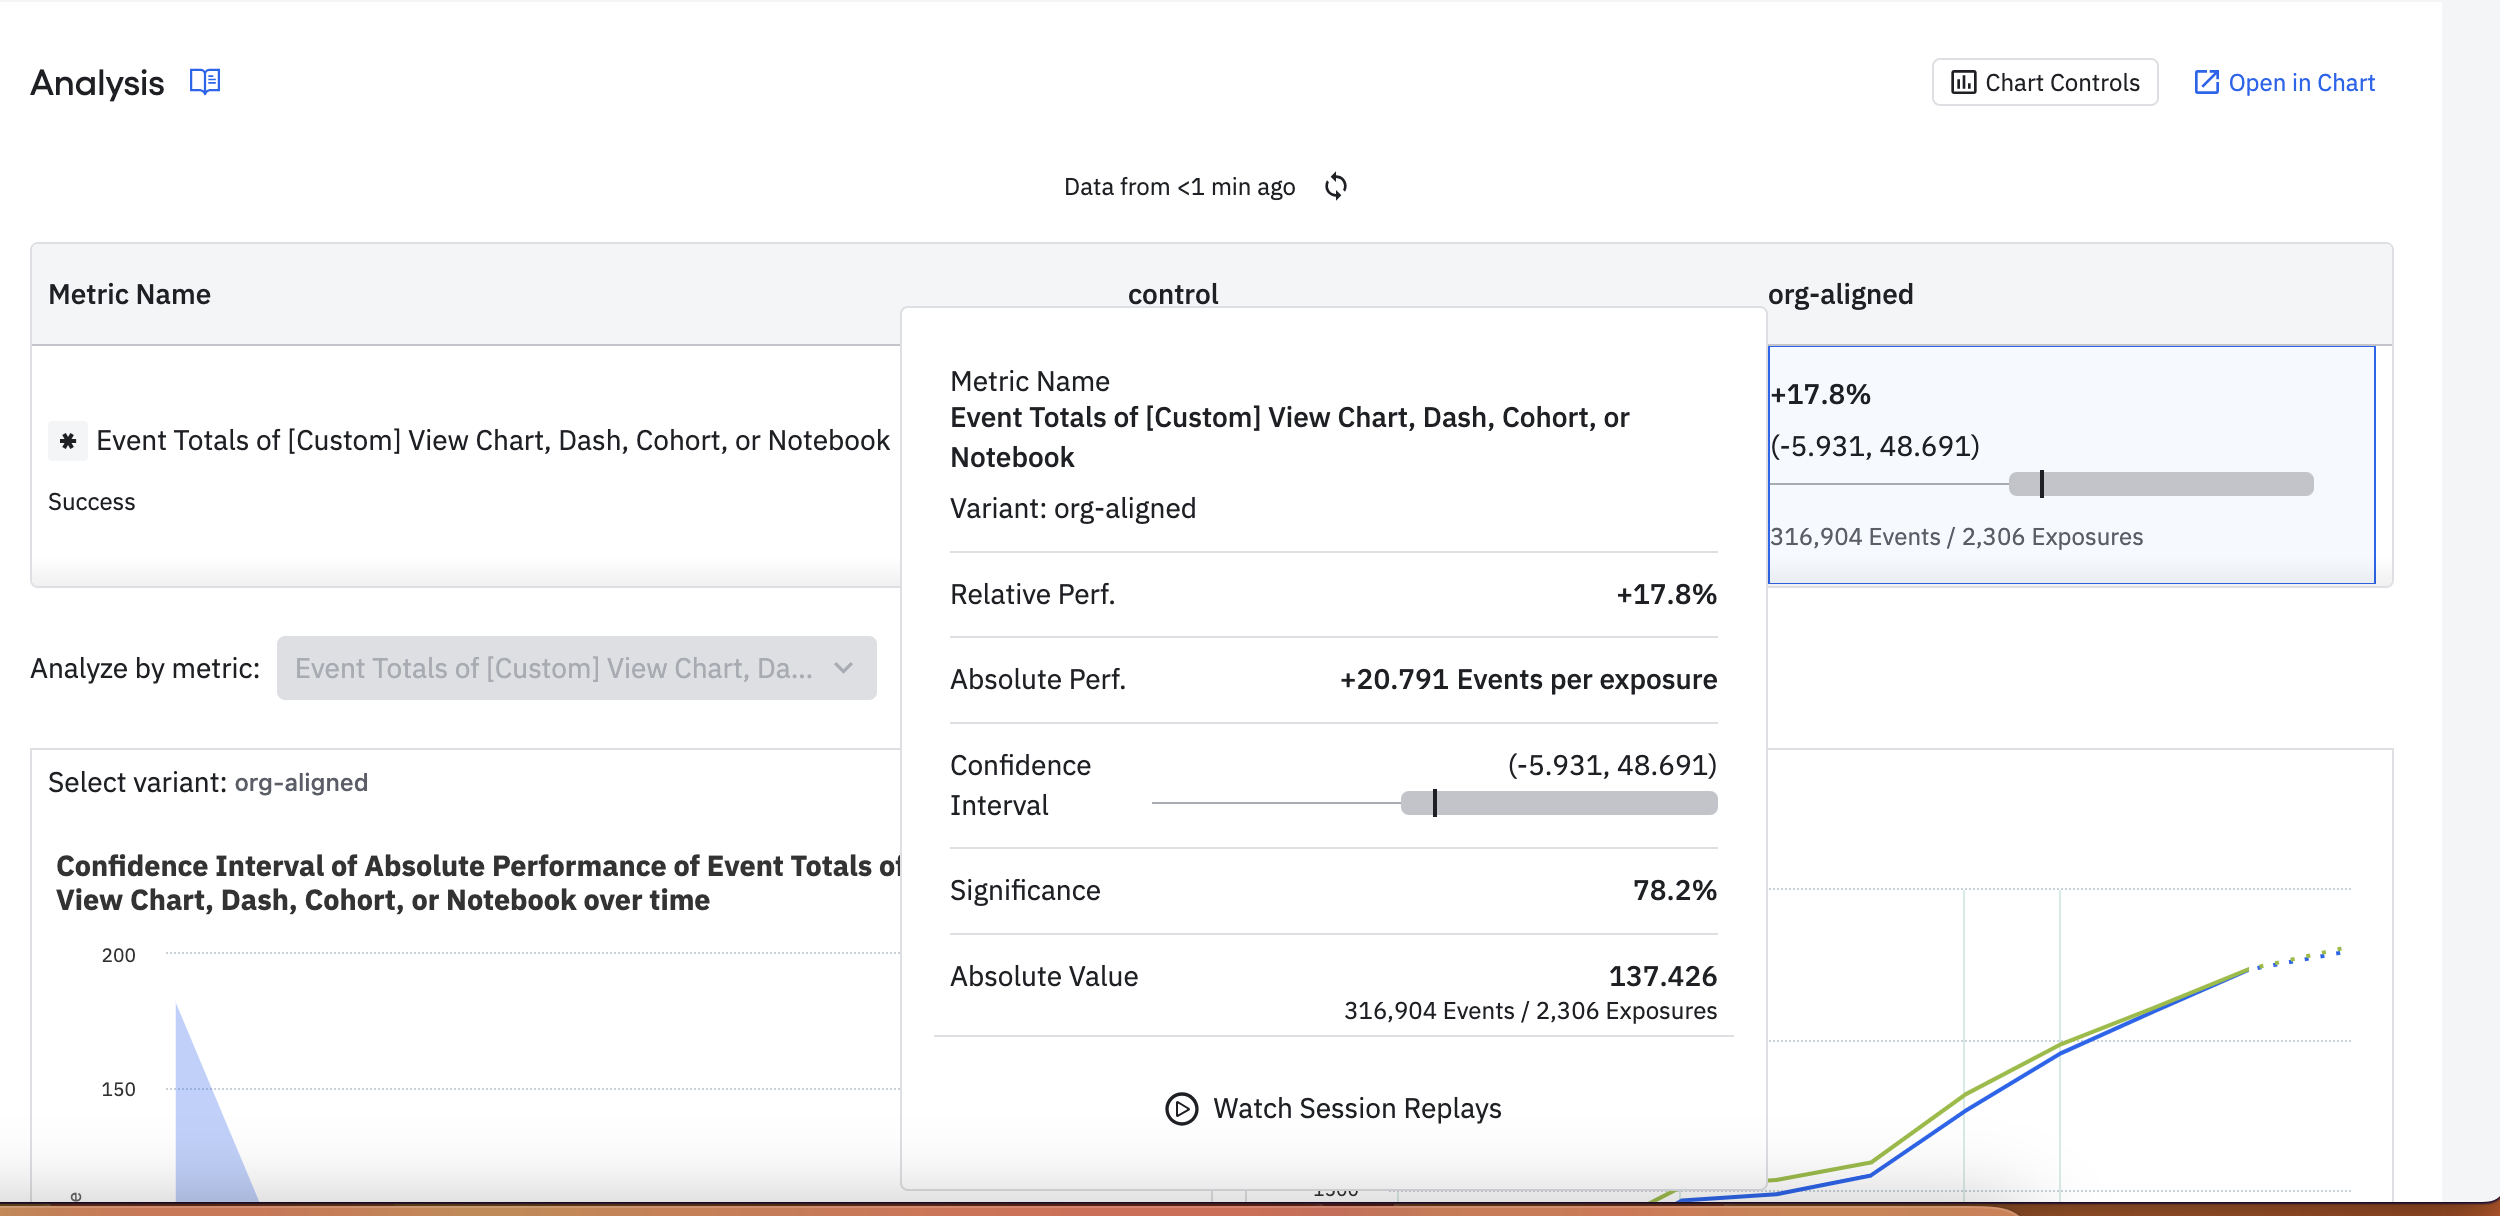
The Experiment Analysis view is where you’ll find the details of your experiment. Select your experiment and then go to Activity > Analysis to view high level statistical measurements about your experiment. These measurements help you understand whether or not your experiment was a success.
This article describes what each of the columns in this table means, and how they relate to your experiment.
Analysis filters and chart options
You can filter the information displayed in the Analysis view. You can filter by time as well as by user or any other property that you want.
Click Select property to filter the analysis view for any available property.
You can also turn your experiment analysis into a chart. Click Open in Chart to automatically turn the analysis into a chart.
Amplitude converts the information from your experiment into the most likely charts. The charts open automatically in a new tab for you. You can then modify or make changes to the charts.
Metric name, Control, and status
The Metric name column contains the names of the selected metrics. The top metric is the recommendation metric. All other metrics are secondary metrics. Hover over a metric's name to read its definition.
The Control column contains information about the control group for your experiment.
The On column contains information about the activity of the experiment as it's running. If the experiment is completed or rolled back, the On column may reflect other, relevant, information such as treatment, property, or so on.
Note
Relative performance
Relative performance measures the relative difference between how the variant performed and how the control performed. This is also known as the relative lift. Cross-check this value by expanding a single metric’s section and then dividing the absolute lift for a variant by the absolute value of the control for that metric.
Confidence interval
The confidence interval is a range of values that includes the parameter you’re trying to measure, which in this case is the difference in the means between the variant and the control. This isn't a probability. You can interpret this as if you conducted this experiment 100 times and have the confidence level set at 95. You can therefore expect the true value of the parameter to fall within this range at least 95 times.
The confidence interval shown reveals characteristics about what the experiment has observed thus far:
- Confidence Interval contains 0: There’s not enough evidence to decide whether there’s a difference between control and treatment.
- Confidence Interval greater than 0: The interval (upper and lower confidence bounds) is greater than zero. Amplitude Experiment has accumulated enough observations to reach statistical significance, and you can conclude that the variant has a positive effect compared to control. For example, if you look at lift, expect a variant with a confidence interval greater than zero can to perform better than the control.
- Confidence Interval less than 0: Amplitude Experiment has accumulated enough observations to reach statistical significance, and you can conclude that the variant has a negative effect compared to control. If, as in the last example, you look at lift, expect a variant with a confidence interval less than zero to perform worse than the control.
If you have multiple variants, select the one you want to view in the confidence interval chart from the drop-down above the chart.
Access the confidence interval by hovering over the control or the experiment metric.
Significance
Significance is the likelihood that the performance displayed for each test variant is actually different from zero, and isn't due to random fluctuations in the data. The higher this value is, the more confident you can be in your results. More formally, this is 1 - p-value.
Absolute value
The specific meaning of the absolute value depends on the metric type. For unique conversions, Experiment expresses values as a percentage, indicating the percentage of users (over the total number of exposed users) who converted for each variant. The numerator (Conversions) and denominator (Exposures) appear below the percentage.
Otherwise, the value indicates the aggregate (total events, sum of property value, average of property value) for each exposed user. The denominator used here is the total number of exposures. For example, 10 total events / 4 exposures = on average, an exposed user had 2.5 conversion events.
Access the absolute value by hovering over the control or metric name.
February 21st, 2025
Need help? Contact Support
Visit Amplitude.com
Have a look at the Amplitude Blog
Learn more at Amplitude Academy
© 2025 Amplitude, Inc. All rights reserved. Amplitude is a registered trademark of Amplitude, Inc.